Cold Aisle Containment: Case Study – Digital Realty
The Task:
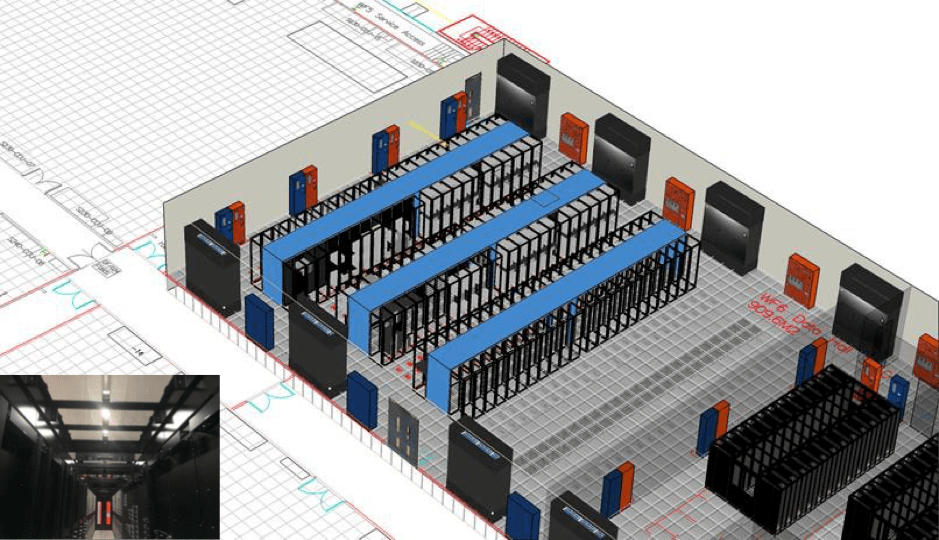
Cross-Guard have been working with our client Digital Realty for a number of years and they asked us to design and install Cold Aisle Containment solution with active roof within the data hall
The Challenge:
The requirement of the client was to install 3xno enclosures around their equipment during live operation and to overcome issues with overhead fiber cables and services that were conflicting with CAC roof.
The Solution:
The Cross-Guard project team visited the site and devised a bespoke design of CAC. Working with our client we designed bespoke solution where infill panels were used to raise the CAC roof to necessary height, developed installation method that allowed installation on open racks during live operation and assembly of CAC without any drilling or cutting inside the data hall.
The Benefits:
PUE
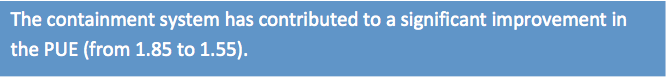
– The containment system has contributed to a significant improvement in the PUE (from 1.85 to 1.55).
Power Consumption
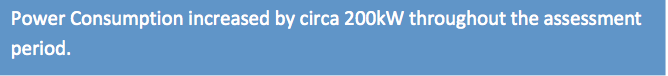
– The IT load within the suite grew from circa 350kW to circa 550kW during the period of the assessment. The total suite load (including ancillary loads) rose from 650kW to 850kW during the same period.
Savings and ROI
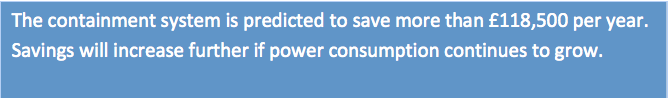
– The containment system is predicted to save more than £118,500.00 per year. Savings will increase further if power consumption continues to grow.
– Return on investment will be achieved in approximately 5 months
Cold Aisle temperature
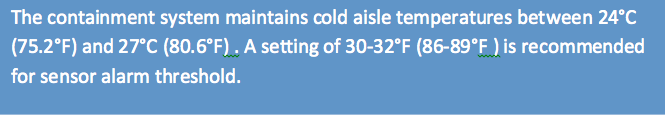
– The containment system maintains cold aisle temperatures between 24°C (75.2°F) and 27°C (80.6°F) . A setting of 30-32°F (86-89°F ) is recommended for sensor alarm threshold.

Benefits of Containment
Digital Realty
1. Introduction
Digital Realty has recently been working with a valued customer to demonstrate and quantify the benefits or otherwise of cold aisle containment systems in data centre environments with respect to efficiency.
Digital Realty collected thorough power, PUE and temperature data before, during and after the installation of a containment system in Q4 of 2014. The customer’s business and IT operation was unaffected by the installation, in fact showing steady growth as equipment deployments continued unhindered. This report documents the key findings made.
With permission the customer has permitted this report to be released anonymously for the benefit of others in the industry.
2. Overview
A full diary of events is provided in Appendix A however the changes made in the data centre can be broadly categorised as follows:
- Legacy Mode of Operation – CRAH supply temperatures were reduced, and flow rates were increased to deliver cold air to the IT equipment in an open, uncontained arrangement of hot and cold
- Cold Aisle Containment Installation – A cold aisle containment system was installed around the customer’s equipment during live operation with the CRAH settings remaining as Other IT equipment within the suite already have containment installed but accounts for the minority (less than 30%) of the total IT load.
- Efficient Mode of Operation – CRAH supply temperatures were increased, and flow rates were decreased to save energy whilst relying on the containment system to ensure delivery of cooling to the IT
The datacenter has remained fully operational throughout the course of this work therefore some events may not been recorded. A representation of the equipment layout is shown in Figure 1.
3. Collection of Data
Data has been collected via:
- Temperature sensors located at strategic locations around the datacentre
- Building Management System (BMS) logs for the following:
- IT Load
- Total Suite Load (IT Load plus ancillary loads)
- PUE
Of that data, that which best communicates the findings is analysed and presented in the appendices section of this report.
4. Key Findings
The following sections describe the key findings from the assessment. The data on which these findings are based is provided in Appendices A-D and are referenced accordingly.
PUE
Power Utilisation Effectiveness (PUE)1 was measured throughout the assessment.
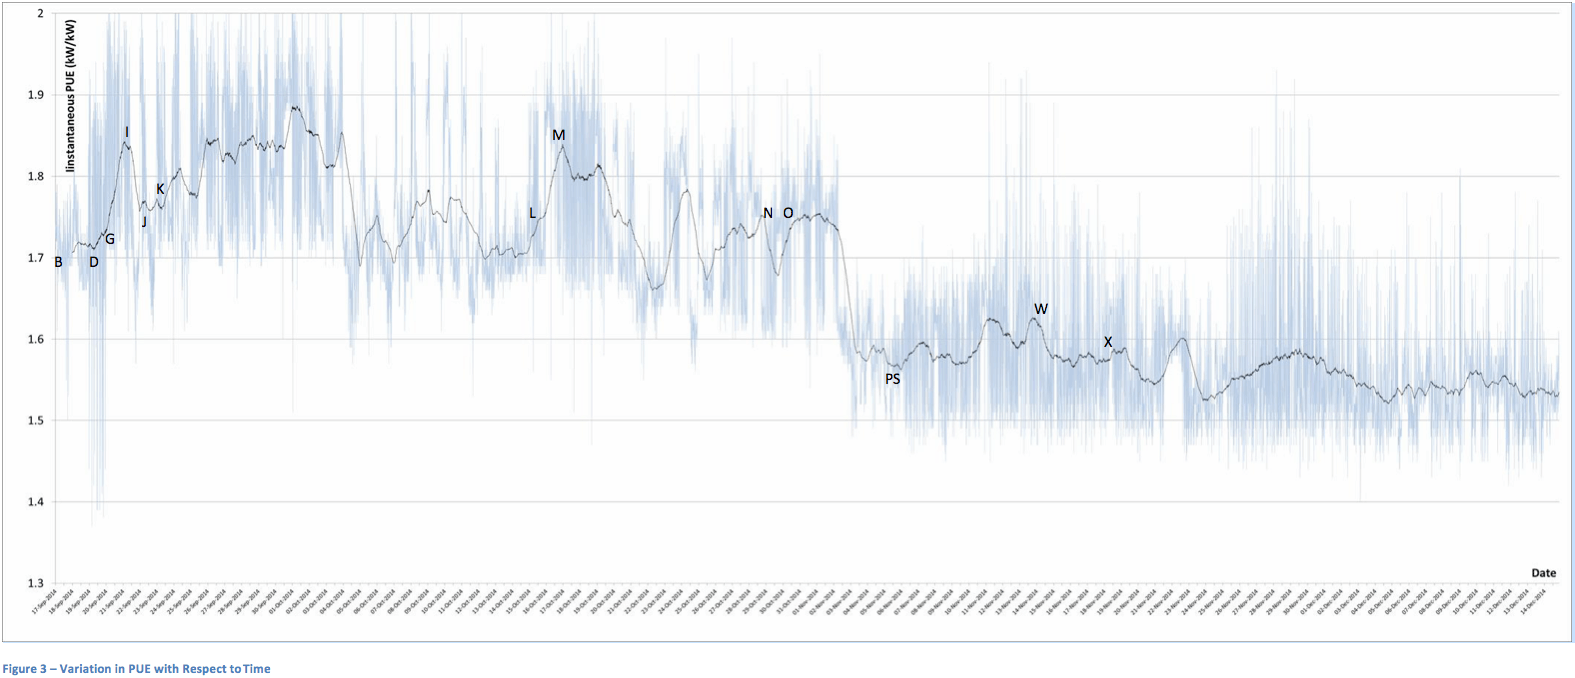
Between the 20th September and 14th October the data centre was operated in Legacy Mode of Operation. CRAH unit fans were set to operate at between 70% and 80% of their maximum flow rates, and supply temperatures were set to supply at 21°C (69.8°F). This method of operating a datacentre is typical of many older datacentres that do not utilise a containment system. During this period the instantaneous PUE remained at circa 1.85.
Between the 15th October and 30th October the containment system was installed. The PUE improved during this period as the level of containment gradually improved. The PUE was observed to fluctuate at around 1.75 falling to around 1.6 after the containment lids were fully closed.
Subsequent changes to increase the CRAH supply temperature improved the PUE further to its current level of circa 1.55.
Other factors, such as the increasing IT load and falling external ambient temperature are expected to contribute to the improvement in PUE.
However the correlation between changes made in the data hall and the PUE recorded are strong as shown in Appendix C. Therefore the majority of the improvement can be attributed to the installation of the containment system alone.
1 Power Utilisation Effectiveness by The Green Grid – Further information relating to the PUE metric may be found at the following URL: http://en.wikipedia.org/wiki/Power_usage_effectiveness
Power Consumption
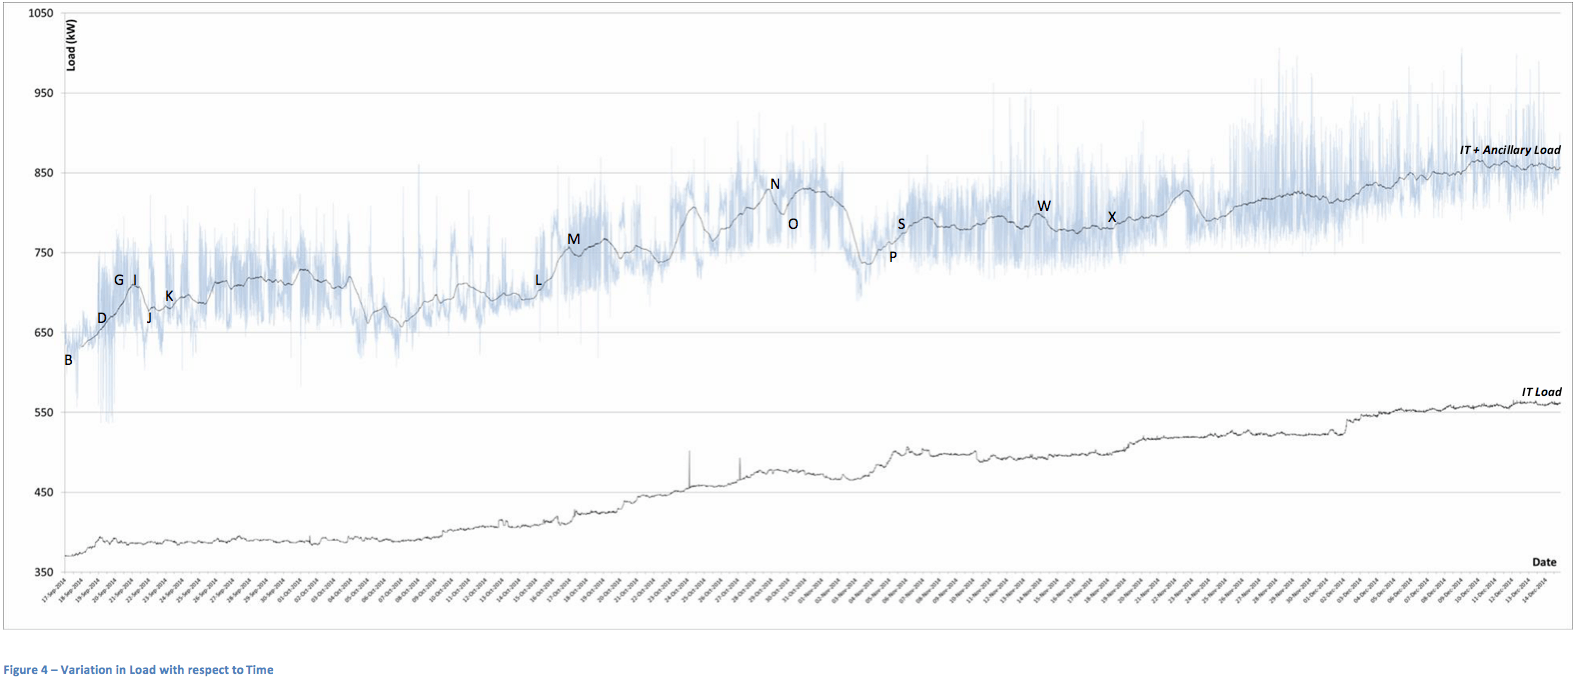
The IT load within the suite grew from circa 350kW to circa 550kW during the period of the assessment. The total suite load (including ancillary loads) rose from 650kW to 850kW during the same period.
Savings
The following rough calculation estimates the amount of money that will be saved in the coming year by operating at the current IT load (550kW) at the improved PUE of (1.55) compared to the legacy PUE of (1.85). Load growth and change in energy price is ignored, but will only serve to make the savings greater.
[IT load] x [PUE] x [Hours in a year] x [Energy price per kWh] = [Total Annual Energy Cost]
Therefore at a PUE of 1.55 a 550kW IT loads will cost:
550kW x 1.55 x 8760h x £0.082 = £612,367.80
Whereas at a PUE of 1.85 the same IT load will cost:
550kW x 1.85 x 8760h x £0.082 = £730,890.60
This equates to a saving of £118,522.80 per annum across the whole suite.
This equates to a saving of £83,612.45 per annum to this particular customer since they account for 71% of the total power consumption within the data hall. The resident customers are metered separately and billed accordingly so these savings will be experienced in those bills immediately.
Return on Investment
The containment system cost in the region of £50,000 to supply and install. Therefore payback will be achieved in approximately 5 months (7 months if calculated based on the savings for only this customer). These savings are passed directly to Digital Realty’s customers.
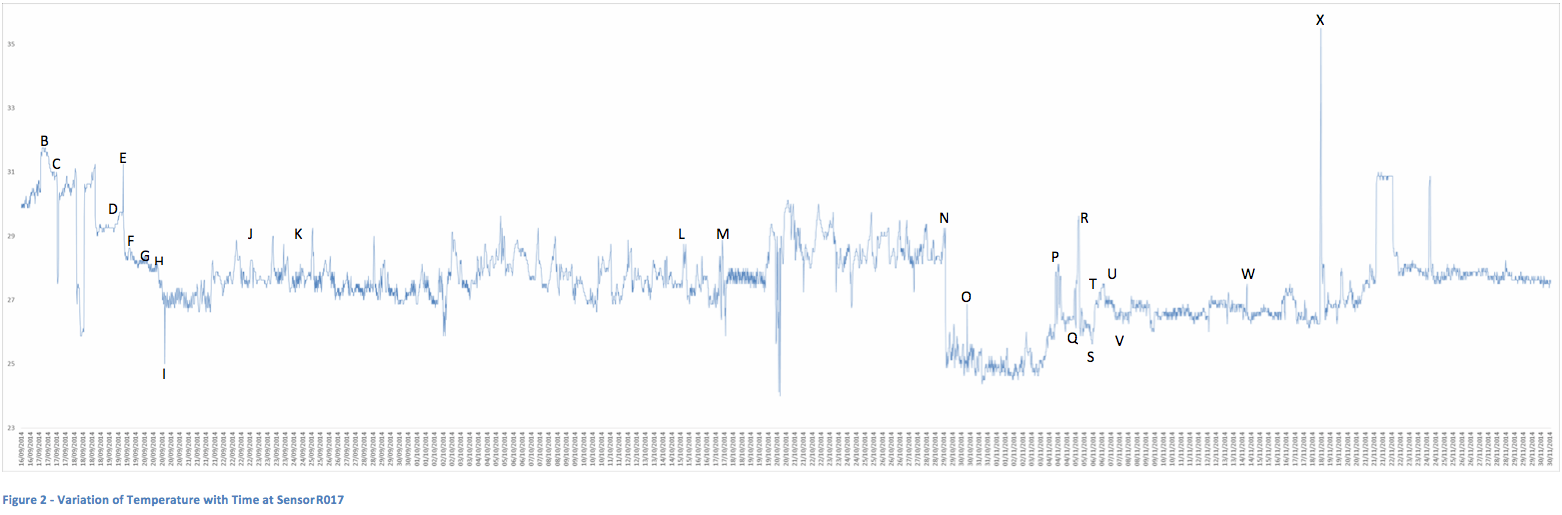
Cold Aisle Temperature
The customer has a temperature sensor positioned at the top front of one of its racks. Previous work has shown that this temperature sensor is positioned appropriately; serving as a good KPI for the hottest temperature in the cold aisle. Temperatures recorded close to this sensor throughout the period of the assessment are provided in Appendix B. The sensor is used by the customer to trigger alerts in the event of temperatures rising above a set threshold.
The installation of the containment system effectively manages the temperature of air within the cold aisle. It prevents the ingress of hot air into the cold aisle and achieves a more consistent temperature of supply across all U-slots. This improves efficiency, but also eliminates the presence of hot-spots taking doubt away from future equipment installations. Ultimately a consistent temperature of between approx. 24°C (75.2°F) and 27°C (80.6°F) is achieved throughout the cold aisle. This is consistent with ASHRAE’s recommended range2 for IT equipment.
In theory the containment system should ensure that only air originating from the floor grilles reaches the IT equipment. If IT equipment needs more air, then it should have no option but to suck it from the floor void. The temperatures at the top of the racks should tend to the supply set-point of 24°C (75.2°F) but the temperature sensors (Appendix B) show this not to be the case.
The customer has been in the process of deploying their IT equipment throughout the period of this assessment therefore as one would reasonably expect:
- blanking panels have not always been installed in vacant u-slots
- not all IT equipment is powered
- containment doors are opened and closed
Hot air is therefore able to pass through these openings or pass backwards through the off IT equipment to enter the cold aisle and re-supply the equipment. The cooling system’s control system is not set-up to react to this issue therefore the temperature reported at the sensor is elevated.
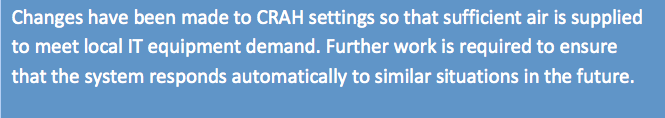
The solution has been to manually set the CRAH units to supply more air than is required by the IT equipment. This serves to over pressurise the cold aisle and overcomes the ingress of most of the hot air. In this mode of operation the temperature measured at the temperature sensor is at circa 27°C (80.6°F) some 3°C (5.4°F) hotter than the temperature of air supplied.
If the customer addresses these issues then it may well be possible to reduce the volume of air provided, making further energy savings however an improved control strategy is also required.
A setting of between 30-32°C is recommended for the setting of the aforementioned alarm threshold. An alarm therefore would provide indication of rising aisle temperatures before equipment temperatures rise above the ASHRAE allowable range.
2 ASHRAE –Thermal Guidelines for Data Processing Environments ISBN 978-1-936504-33-6
Control Strategy
The expectation is that the cooling system will respond to local demand for cooling by delivering more cooling where and when it is needed in an automated fashion. It is reasonable to expect customers to have periods when blanking panels are absent or when IT equipment is switched off. The system should respond accordingly within the limits of its design capabilities.
The default control strategy is set so that the receipt of high temperature air at a CRAH unit’s return vent triggers that unit alone to increase its flow rate. This approach is reasonable in scenarios whereby IT equipment load is distributed across the data-hall. This is because multiple CRAH units are likely to ‘feel’ heat and contribute together to deliver increased airflow to the IT equipment.
In the customer’s deployment IT load is concentrated in one area (Figure 1). Only the CRAH units local to the load respond to the heat at their return vents by delivering more airflow to the floor void. This additional air supply spreads throughout the floor void and fails to reach the equipment that needs it.
During this assessment, and thereafter it has been necessary to override the default control system forcing all of the CRAH fans to deliver between 70% and 80% of their maximum flow. Whilst effective, this solution is energy inefficient and draws into question the suitability of the default control strategy for this application.
Digital Realty will review alternative control strategies for consideration to redress this issue as soon as possible.
5. Conclusions
The assessment has proven the containment system to be beneficial in a number of areas:
- Improved energy efficiency
- Reduced PUE
- Improved temperature control (i.e. elimination of hot-spots)
- Return in investment within circa 5 months (7 months if attributed only to this customer)
- Benefits will improve further as load increases
- Benefits will improve further if best practices are followed with respect to blanking installation
- Reduced energy consumption will save more than £118,500 per year (£83,600 if attributed only to this customer)
Data centre owner/operators often struggle to realise the full potential of their facilities. As hot- spots occur the data centre is considered ‘full’ prematurely even though power remains available. Arguably the greatest benefit of the containment system is its ability to prevent those hot-spots and in so doing allow more equipment to be installed. Across a large data centre estate this ‘asset sweating’ benefit will be considerable.
Further opportunities for improvement have been identified as follows:
- Modify CRAH control strategy to respond to increased local demand for airflow
- Improve policy with respect to installation of blanking in vacant u-slots
- Reduce the quantity of equipment that is installed but switched off The downsides of the systems are:
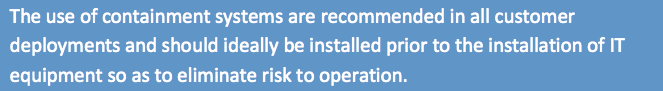
- The installation of a containment system on a live environment carries a level of risk which must be carefully managed unless installed on
- That operatives have to open and close the containment system doors during the installation of IT
These inconveniences are considered to be a small price to pay for the benefits outlined above.
The containment solution is likely to offer similar benefits if installed in other similar installations worldwide. The magnitude of the benefits will differ in relation to external factors such as those listed below, however on the whole the containment system is still likely to be worthwhile.
- energy cost $/kWh
- cooling system design
- external environmental conditions
- IT loading level
6. Appendices
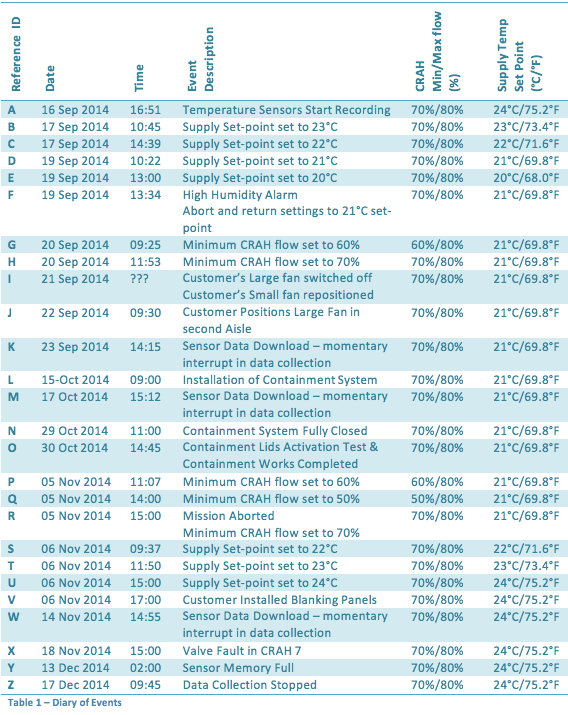
Appendix A: Diary of Events
A diary of events is shown in Table 1. The references for these events are marked onto the graphs provided in Appendix B and C so that the data centre’s response to the change can easily be seen.
Appendix B: Temperature Variation
The graph below shows the variation in temperature measured at Sensor R017 (positioned towards the top of Rack 22) with respect to time. The events from Appendix A are superimposed onto that graph.
Sensor R017 has been shown previously to be a good KPI for the worst case temperatures seen throughout the cold aisle. It is located immediately adjacent to the sensor which The customer uses to provide thermal alarm. As such only data from this sensor has been analysed in this section. Data from other sensors is stored and available for future analysis required.
Appendix C: PUE
The variation in PUE across the entire data hall is shown in Figure 3. This data has been directly outputted from the building’s BMS for the period of the analysis. A trend-line, based on a moving average is superimposed to aid interpretation of the data. The events from Appendix A are superimposed onto that graph.
Appendix D: Load
The variation in Load is presented in Figure 4. The lower data series shows the IT load alone. The upper data series shows the IT Load plus all ancillary loads incurred in its provision (i.e. cooling system loads, UPS losses, lighting and all other incidental loads included in the calculation of PUE are included). The graphs are annotated with the key events as provided in Appendix A.
A steady growth in IT load is witnessed throughout the period of the assessment as the customers deploy more IT equipment within the suite.
SHARE
DOWNLOAD A COPY OF OUR BROCHURE
